Load rheology data
If you have a google account you can run this documentation notebook Open in colab
[ ]:
from IPython.display import clear_output
!pip install git+https://github.com/rheopy/rheofit.git --upgrade
clear_output()
[ ]:
import rheofit
import numpy as np
import pandas as pd
import pybroom as pb
import matplotlib.pyplot as plt
import seaborn as sns
sns.set_style('whitegrid')
The module rheofit.rheodata provides a class to store structured rheology data.
We initially focus loading datafile exported by the trios software in two possible format:
- Excel format - as structured by the trios software with the multitab export opion
- Rheoml format rheoml link
Import data from Multitab excel (assuming format exported by TA Trios)
[ ]:
# Download example of xls file format
import requests

url = 'https://github.com/rheopy/rheofit/raw/master/docs/source/_static/Flow_curve_example.xls'
r = requests.get(url, allow_redirects=True)
with open('Flow_curve_example.xls', 'wb') as file:
    file.write(r.content)
[4]:
excel_file=pd.ExcelFile('Flow_curve_example.xls')
excel_file.sheet_names
[4]:
['Details', 'Flow sweep - 1', 'Flow sweep - 2']
[ ]:
flow_curve=rheofit.rheodata.rheology_data('Flow_curve_example.xls')
[6]:
flow_curve.filename
[6]:
'Flow_curve_example.xls'
[7]:
flow_curve.Details
[7]:
| Filename | Flow_curve_example | |
|---|---|---|
| 0 | Instrument name | 5333-0138 |
| 1 | Operator | NaN |
| 2 | rundate | 2018-12-11 00:00:00 |
| 3 | proceduresegments | Flow sweep#Flow sweep |
[8]:
flow_curve[0]
[8]:
('Flow sweep - 1',
     index    Stress  Shear rate  ...  Step time  Temperature  Normal stress
 0     1.0  0.005880    0.009983  ...     33.315       24.994       -25.6271
 1     2.0  0.008049    0.012570  ...     44.440       24.997       -26.1219
 2     3.0  0.010172    0.015820  ...     53.508       25.000       -25.0472
 3     4.0  0.012829    0.019934  ...     62.558       24.993       -25.1450
 4     5.0  0.015199    0.025083  ...     69.590       25.000       -24.7538
 5     6.0  0.017969    0.031625  ...     76.633       25.005       -24.6068
 6     7.0  0.020827    0.039800  ...     83.694       25.002       -24.4271
 7     8.0  0.023693    0.050126  ...     90.740       25.005       -24.7584
 8     9.0  0.026287    0.063106  ...     97.778       25.001       -24.7708
 9    10.0  0.028844    0.079445  ...    104.824       24.995       -25.3449
 10   11.0  0.031365    0.100010  ...    111.873       25.001       -24.9789
 11   12.0  0.033939    0.125897  ...    118.938       25.003       -25.1281
 12   13.0  0.036628    0.158455  ...    125.996       25.010       -25.0322
 13   14.0  0.039391    0.199556  ...    133.069       24.995       -24.8767
 14   15.0  0.042912    0.251095  ...    140.150       24.997       -24.4607
 15   16.0  0.046108    0.316190  ...    147.219       25.003       -24.6772
 16   17.0  0.049718    0.398159  ...    154.326       24.996       -24.2384
 17   18.0  0.053788    0.501198  ...    161.448       25.006       -24.2333
 18   19.0  0.058068    0.630964  ...    168.494       24.999       -24.3097
 19   20.0  0.062908    0.794320  ...    175.547       25.000       -24.6427
 20   21.0  0.069119    0.999982  ...    182.598       24.994       -23.7068
 21   22.0  0.074739    1.258940  ...    189.655       24.999       -24.1146
 22   23.0  0.082171    1.584930  ...    196.694       25.000       -24.0175
 23   24.0  0.089936    1.995270  ...    203.744       25.002       -24.0197
 24   25.0  0.098643    2.511930  ...    210.815       25.001       -24.9362
 25   26.0  0.110487    3.162250  ...    217.880       25.001       -24.0751
 26   27.0  0.122997    3.981210  ...    224.931       25.000       -24.4437
 27   28.0  0.137976    5.011840  ...    231.962       24.993       -24.2209
 28   29.0  0.154989    6.309610  ...    239.026       25.000       -24.5888
 29   30.0  0.173632    7.943300  ...    246.089       25.000       -25.4283
 30   31.0  0.194705   10.000000  ...    253.179       25.003       -25.0795
 31   32.0  0.218630   12.589200  ...    260.276       24.998       -24.8872
 32   33.0  0.248592   15.848800  ...    267.361       25.001       -25.8492
 33   34.0  0.283036   19.952700  ...    274.451       25.001       -26.1736
 34   35.0  0.322480   25.118900  ...    281.521       25.001       -26.8024
 35   36.0  0.371139   31.623000  ...    288.581       24.999       -25.3216
 36   37.0  0.428138   39.810700  ...    295.635       24.993       -24.7829
 37   38.0  0.495414   50.118600  ...    302.692       24.999       -24.4378
 38   39.0  0.575723   63.095600  ...    309.746       25.003       -25.0006
 39   40.0  0.671613   79.433100  ...    316.798       25.003       -25.5528
 40   41.0  0.785998  100.000000  ...    323.838       24.997       -25.9320

 [41 rows x 7 columns])
[9]:
print(flow_curve[0][0])
flow_curve[0][1]
Flow sweep - 1
[9]:
| index | Stress | Shear rate | Viscosity | Step time | Temperature | Normal stress | |
|---|---|---|---|---|---|---|---|
| 0 | 1.0 | 0.005880 | 0.009983 | 0.588953 | 33.315 | 24.994 | -25.6271 |
| 1 | 2.0 | 0.008049 | 0.012570 | 0.640324 | 44.440 | 24.997 | -26.1219 |
| 2 | 3.0 | 0.010172 | 0.015820 | 0.643003 | 53.508 | 25.000 | -25.0472 |
| 3 | 4.0 | 0.012829 | 0.019934 | 0.643584 | 62.558 | 24.993 | -25.1450 |
| 4 | 5.0 | 0.015199 | 0.025083 | 0.605968 | 69.590 | 25.000 | -24.7538 |
| 5 | 6.0 | 0.017969 | 0.031625 | 0.568177 | 76.633 | 25.005 | -24.6068 |
| 6 | 7.0 | 0.020827 | 0.039800 | 0.523307 | 83.694 | 25.002 | -24.4271 |
| 7 | 8.0 | 0.023693 | 0.050126 | 0.472677 | 90.740 | 25.005 | -24.7584 |
| 8 | 9.0 | 0.026287 | 0.063106 | 0.416561 | 97.778 | 25.001 | -24.7708 |
| 9 | 10.0 | 0.028844 | 0.079445 | 0.363072 | 104.824 | 24.995 | -25.3449 |
| 10 | 11.0 | 0.031365 | 0.100010 | 0.313623 | 111.873 | 25.001 | -24.9789 |
| 11 | 12.0 | 0.033939 | 0.125897 | 0.269577 | 118.938 | 25.003 | -25.1281 |
| 12 | 13.0 | 0.036628 | 0.158455 | 0.231158 | 125.996 | 25.010 | -25.0322 |
| 13 | 14.0 | 0.039391 | 0.199556 | 0.197392 | 133.069 | 24.995 | -24.8767 |
| 14 | 15.0 | 0.042912 | 0.251095 | 0.170900 | 140.150 | 24.997 | -24.4607 |
| 15 | 16.0 | 0.046108 | 0.316190 | 0.145823 | 147.219 | 25.003 | -24.6772 |
| 16 | 17.0 | 0.049718 | 0.398159 | 0.124870 | 154.326 | 24.996 | -24.2384 |
| 17 | 18.0 | 0.053788 | 0.501198 | 0.107319 | 161.448 | 25.006 | -24.2333 |
| 18 | 19.0 | 0.058068 | 0.630964 | 0.092030 | 168.494 | 24.999 | -24.3097 |
| 19 | 20.0 | 0.062908 | 0.794320 | 0.079198 | 175.547 | 25.000 | -24.6427 |
| 20 | 21.0 | 0.069119 | 0.999982 | 0.069120 | 182.598 | 24.994 | -23.7068 |
| 21 | 22.0 | 0.074739 | 1.258940 | 0.059366 | 189.655 | 24.999 | -24.1146 |
| 22 | 23.0 | 0.082171 | 1.584930 | 0.051845 | 196.694 | 25.000 | -24.0175 |
| 23 | 24.0 | 0.089936 | 1.995270 | 0.045075 | 203.744 | 25.002 | -24.0197 |
| 24 | 25.0 | 0.098643 | 2.511930 | 0.039270 | 210.815 | 25.001 | -24.9362 |
| 25 | 26.0 | 0.110487 | 3.162250 | 0.034939 | 217.880 | 25.001 | -24.0751 |
| 26 | 27.0 | 0.122997 | 3.981210 | 0.030894 | 224.931 | 25.000 | -24.4437 |
| 27 | 28.0 | 0.137976 | 5.011840 | 0.027530 | 231.962 | 24.993 | -24.2209 |
| 28 | 29.0 | 0.154989 | 6.309610 | 0.024564 | 239.026 | 25.000 | -24.5888 |
| 29 | 30.0 | 0.173632 | 7.943300 | 0.021859 | 246.089 | 25.000 | -25.4283 |
| 30 | 31.0 | 0.194705 | 10.000000 | 0.019471 | 253.179 | 25.003 | -25.0795 |
| 31 | 32.0 | 0.218630 | 12.589200 | 0.017366 | 260.276 | 24.998 | -24.8872 |
| 32 | 33.0 | 0.248592 | 15.848800 | 0.015685 | 267.361 | 25.001 | -25.8492 |
| 33 | 34.0 | 0.283036 | 19.952700 | 0.014185 | 274.451 | 25.001 | -26.1736 |
| 34 | 35.0 | 0.322480 | 25.118900 | 0.012838 | 281.521 | 25.001 | -26.8024 |
| 35 | 36.0 | 0.371139 | 31.623000 | 0.011736 | 288.581 | 24.999 | -25.3216 |
| 36 | 37.0 | 0.428138 | 39.810700 | 0.010754 | 295.635 | 24.993 | -24.7829 |
| 37 | 38.0 | 0.495414 | 50.118600 | 0.009885 | 302.692 | 24.999 | -24.4378 |
| 38 | 39.0 | 0.575723 | 63.095600 | 0.009125 | 309.746 | 25.003 | -25.0006 |
| 39 | 40.0 | 0.671613 | 79.433100 | 0.008455 | 316.798 | 25.003 | -25.5528 |
| 40 | 41.0 | 0.785998 | 100.000000 | 0.007860 | 323.838 | 24.997 | -25.9320 |
[10]:
print(flow_curve[1][0])
flow_curve[1][1]
Flow sweep - 2
[10]:
| index | Shear rate | Stress | Viscosity | Step time | Temperature | Normal stress | |
|---|---|---|---|---|---|---|---|
| 0 | 1.0 | 100.000000 | 0.785576 | 0.007856 | 7.035 | 24.994 | -25.8372 |
| 1 | 2.0 | 79.433600 | 0.667926 | 0.008409 | 14.122 | 25.001 | -25.5272 |
| 2 | 3.0 | 63.095600 | 0.570374 | 0.009040 | 21.198 | 24.996 | -26.0631 |
| 3 | 4.0 | 50.118600 | 0.488046 | 0.009738 | 28.277 | 24.992 | -25.5495 |
| 4 | 5.0 | 39.810900 | 0.418776 | 0.010519 | 35.368 | 25.000 | -25.1221 |
| 5 | 6.0 | 31.622800 | 0.362210 | 0.011454 | 42.464 | 25.000 | -24.7939 |
| 6 | 7.0 | 25.118800 | 0.312748 | 0.012451 | 49.513 | 24.997 | -25.0236 |
| 7 | 8.0 | 19.952600 | 0.272681 | 0.013666 | 56.564 | 24.997 | -24.8406 |
| 8 | 9.0 | 15.849000 | 0.237302 | 0.014973 | 63.607 | 24.995 | -24.2895 |
| 9 | 10.0 | 12.589200 | 0.208064 | 0.016527 | 70.656 | 25.000 | -24.5804 |
| 10 | 11.0 | 10.000100 | 0.184503 | 0.018450 | 77.711 | 25.004 | -24.4302 |
| 11 | 12.0 | 7.943290 | 0.163466 | 0.020579 | 84.746 | 25.004 | -24.3919 |
| 12 | 13.0 | 6.309580 | 0.145409 | 0.023046 | 91.794 | 25.010 | -24.5962 |
| 13 | 14.0 | 5.011880 | 0.129136 | 0.025766 | 98.848 | 25.000 | -24.0725 |
| 14 | 15.0 | 3.981060 | 0.115819 | 0.029092 | 105.905 | 25.001 | -23.8453 |
| 15 | 16.0 | 3.162210 | 0.103842 | 0.032838 | 112.949 | 24.994 | -24.3510 |
| 16 | 17.0 | 2.511900 | 0.092936 | 0.036998 | 120.018 | 25.004 | -24.1651 |
| 17 | 18.0 | 1.995260 | 0.083104 | 0.041651 | 127.137 | 25.011 | -24.9261 |
| 18 | 19.0 | 1.584890 | 0.075876 | 0.047875 | 134.239 | 25.007 | -25.1530 |
| 19 | 20.0 | 1.258930 | 0.069237 | 0.054996 | 141.333 | 25.007 | -25.3752 |
| 20 | 21.0 | 1.000000 | 0.063321 | 0.063321 | 148.438 | 24.997 | -24.9206 |
| 21 | 22.0 | 0.794341 | 0.057866 | 0.072847 | 155.485 | 24.997 | -25.0953 |
| 22 | 23.0 | 0.630945 | 0.052395 | 0.083042 | 162.535 | 25.001 | -24.8977 |
| 23 | 24.0 | 0.501209 | 0.048758 | 0.097282 | 169.591 | 24.996 | -25.1164 |
| 24 | 25.0 | 0.397933 | 0.045239 | 0.113685 | 176.654 | 24.999 | -24.8320 |
| 25 | 26.0 | 0.316361 | 0.042102 | 0.133082 | 183.713 | 25.002 | -24.6545 |
| 26 | 27.0 | 0.251194 | 0.038813 | 0.154514 | 190.778 | 24.997 | -24.5867 |
| 27 | 28.0 | 0.199529 | 0.036004 | 0.180445 | 197.823 | 25.001 | -25.0682 |
| 28 | 29.0 | 0.158457 | 0.033902 | 0.213948 | 204.876 | 25.001 | -24.4285 |
| 29 | 30.0 | 0.125873 | 0.032007 | 0.254278 | 211.941 | 25.010 | -24.5144 |
| 30 | 31.0 | 0.100015 | 0.030270 | 0.302651 | 219.003 | 24.993 | -24.9915 |
| 31 | 32.0 | 0.079428 | 0.028780 | 0.362346 | 226.127 | 24.995 | -24.6282 |
| 32 | 33.0 | 0.063095 | 0.027333 | 0.433201 | 233.252 | 25.006 | -24.9416 |
| 33 | 34.0 | 0.050111 | 0.026040 | 0.519641 | 240.369 | 25.007 | -24.5353 |
| 34 | 35.0 | 0.039809 | 0.025020 | 0.628512 | 247.469 | 25.006 | -24.4186 |
| 35 | 36.0 | 0.031607 | 0.024103 | 0.762564 | 254.532 | 25.002 | -23.9567 |
| 36 | 37.0 | 0.025114 | 0.023194 | 0.923548 | 261.572 | 24.997 | -24.4094 |
| 37 | 38.0 | 0.019941 | 0.022509 | 1.128780 | 268.612 | 25.008 | -24.5010 |
| 38 | 39.0 | 0.015855 | 0.021778 | 1.373590 | 275.666 | 24.995 | -24.7634 |
| 39 | 40.0 | 0.012586 | 0.021109 | 1.677160 | 282.723 | 25.006 | -25.1692 |
| 40 | 41.0 | 0.009999 | 0.020585 | 2.058600 | 289.775 | 25.002 | -24.8307 |
[11]:
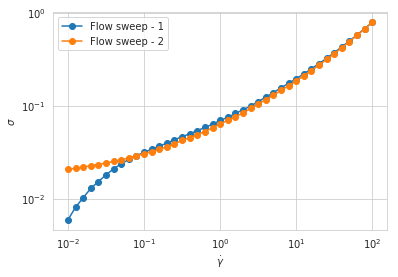
# In summary
flow_curve=rheofit.rheodata.rheology_data('Flow_curve_example.xls')
for (label,data) in flow_curve:
  plt.loglog('Shear rate','Stress',data=data,marker='o',label=label)
  plt.xlabel('$\dot\gamma$')
  plt.ylabel('$\sigma$')
  plt.legend()
[12]:
flow_curve.tidy
[12]:
| index | Stress | Shear rate | Viscosity | Step time | Temperature | Normal stress | Stepnum | stepname | filename | |
|---|---|---|---|---|---|---|---|---|---|---|
| 0 | 1.0 | 0.005880 | 0.009983 | 0.588953 | 33.315 | 24.994 | -25.6271 | 0 | Flow sweep - 1 | Flow_curve_example.xls |
| 1 | 2.0 | 0.008049 | 0.012570 | 0.640324 | 44.440 | 24.997 | -26.1219 | 0 | Flow sweep - 1 | Flow_curve_example.xls |
| 2 | 3.0 | 0.010172 | 0.015820 | 0.643003 | 53.508 | 25.000 | -25.0472 | 0 | Flow sweep - 1 | Flow_curve_example.xls |
| 3 | 4.0 | 0.012829 | 0.019934 | 0.643584 | 62.558 | 24.993 | -25.1450 | 0 | Flow sweep - 1 | Flow_curve_example.xls |
| 4 | 5.0 | 0.015199 | 0.025083 | 0.605968 | 69.590 | 25.000 | -24.7538 | 0 | Flow sweep - 1 | Flow_curve_example.xls |
| 5 | 6.0 | 0.017969 | 0.031625 | 0.568177 | 76.633 | 25.005 | -24.6068 | 0 | Flow sweep - 1 | Flow_curve_example.xls |
| 6 | 7.0 | 0.020827 | 0.039800 | 0.523307 | 83.694 | 25.002 | -24.4271 | 0 | Flow sweep - 1 | Flow_curve_example.xls |
| 7 | 8.0 | 0.023693 | 0.050126 | 0.472677 | 90.740 | 25.005 | -24.7584 | 0 | Flow sweep - 1 | Flow_curve_example.xls |
| 8 | 9.0 | 0.026287 | 0.063106 | 0.416561 | 97.778 | 25.001 | -24.7708 | 0 | Flow sweep - 1 | Flow_curve_example.xls |
| 9 | 10.0 | 0.028844 | 0.079445 | 0.363072 | 104.824 | 24.995 | -25.3449 | 0 | Flow sweep - 1 | Flow_curve_example.xls |
| 10 | 11.0 | 0.031365 | 0.100010 | 0.313623 | 111.873 | 25.001 | -24.9789 | 0 | Flow sweep - 1 | Flow_curve_example.xls |
| 11 | 12.0 | 0.033939 | 0.125897 | 0.269577 | 118.938 | 25.003 | -25.1281 | 0 | Flow sweep - 1 | Flow_curve_example.xls |
| 12 | 13.0 | 0.036628 | 0.158455 | 0.231158 | 125.996 | 25.010 | -25.0322 | 0 | Flow sweep - 1 | Flow_curve_example.xls |
| 13 | 14.0 | 0.039391 | 0.199556 | 0.197392 | 133.069 | 24.995 | -24.8767 | 0 | Flow sweep - 1 | Flow_curve_example.xls |
| 14 | 15.0 | 0.042912 | 0.251095 | 0.170900 | 140.150 | 24.997 | -24.4607 | 0 | Flow sweep - 1 | Flow_curve_example.xls |
| 15 | 16.0 | 0.046108 | 0.316190 | 0.145823 | 147.219 | 25.003 | -24.6772 | 0 | Flow sweep - 1 | Flow_curve_example.xls |
| 16 | 17.0 | 0.049718 | 0.398159 | 0.124870 | 154.326 | 24.996 | -24.2384 | 0 | Flow sweep - 1 | Flow_curve_example.xls |
| 17 | 18.0 | 0.053788 | 0.501198 | 0.107319 | 161.448 | 25.006 | -24.2333 | 0 | Flow sweep - 1 | Flow_curve_example.xls |
| 18 | 19.0 | 0.058068 | 0.630964 | 0.092030 | 168.494 | 24.999 | -24.3097 | 0 | Flow sweep - 1 | Flow_curve_example.xls |
| 19 | 20.0 | 0.062908 | 0.794320 | 0.079198 | 175.547 | 25.000 | -24.6427 | 0 | Flow sweep - 1 | Flow_curve_example.xls |
| 20 | 21.0 | 0.069119 | 0.999982 | 0.069120 | 182.598 | 24.994 | -23.7068 | 0 | Flow sweep - 1 | Flow_curve_example.xls |
| 21 | 22.0 | 0.074739 | 1.258940 | 0.059366 | 189.655 | 24.999 | -24.1146 | 0 | Flow sweep - 1 | Flow_curve_example.xls |
| 22 | 23.0 | 0.082171 | 1.584930 | 0.051845 | 196.694 | 25.000 | -24.0175 | 0 | Flow sweep - 1 | Flow_curve_example.xls |
| 23 | 24.0 | 0.089936 | 1.995270 | 0.045075 | 203.744 | 25.002 | -24.0197 | 0 | Flow sweep - 1 | Flow_curve_example.xls |
| 24 | 25.0 | 0.098643 | 2.511930 | 0.039270 | 210.815 | 25.001 | -24.9362 | 0 | Flow sweep - 1 | Flow_curve_example.xls |
| 25 | 26.0 | 0.110487 | 3.162250 | 0.034939 | 217.880 | 25.001 | -24.0751 | 0 | Flow sweep - 1 | Flow_curve_example.xls |
| 26 | 27.0 | 0.122997 | 3.981210 | 0.030894 | 224.931 | 25.000 | -24.4437 | 0 | Flow sweep - 1 | Flow_curve_example.xls |
| 27 | 28.0 | 0.137976 | 5.011840 | 0.027530 | 231.962 | 24.993 | -24.2209 | 0 | Flow sweep - 1 | Flow_curve_example.xls |
| 28 | 29.0 | 0.154989 | 6.309610 | 0.024564 | 239.026 | 25.000 | -24.5888 | 0 | Flow sweep - 1 | Flow_curve_example.xls |
| 29 | 30.0 | 0.173632 | 7.943300 | 0.021859 | 246.089 | 25.000 | -25.4283 | 0 | Flow sweep - 1 | Flow_curve_example.xls |
| ... | ... | ... | ... | ... | ... | ... | ... | ... | ... | ... |
| 52 | 12.0 | 0.163466 | 7.943290 | 0.020579 | 84.746 | 25.004 | -24.3919 | 1 | Flow sweep - 2 | Flow_curve_example.xls |
| 53 | 13.0 | 0.145409 | 6.309580 | 0.023046 | 91.794 | 25.010 | -24.5962 | 1 | Flow sweep - 2 | Flow_curve_example.xls |
| 54 | 14.0 | 0.129136 | 5.011880 | 0.025766 | 98.848 | 25.000 | -24.0725 | 1 | Flow sweep - 2 | Flow_curve_example.xls |
| 55 | 15.0 | 0.115819 | 3.981060 | 0.029092 | 105.905 | 25.001 | -23.8453 | 1 | Flow sweep - 2 | Flow_curve_example.xls |
| 56 | 16.0 | 0.103842 | 3.162210 | 0.032838 | 112.949 | 24.994 | -24.3510 | 1 | Flow sweep - 2 | Flow_curve_example.xls |
| 57 | 17.0 | 0.092936 | 2.511900 | 0.036998 | 120.018 | 25.004 | -24.1651 | 1 | Flow sweep - 2 | Flow_curve_example.xls |
| 58 | 18.0 | 0.083104 | 1.995260 | 0.041651 | 127.137 | 25.011 | -24.9261 | 1 | Flow sweep - 2 | Flow_curve_example.xls |
| 59 | 19.0 | 0.075876 | 1.584890 | 0.047875 | 134.239 | 25.007 | -25.1530 | 1 | Flow sweep - 2 | Flow_curve_example.xls |
| 60 | 20.0 | 0.069237 | 1.258930 | 0.054996 | 141.333 | 25.007 | -25.3752 | 1 | Flow sweep - 2 | Flow_curve_example.xls |
| 61 | 21.0 | 0.063321 | 1.000000 | 0.063321 | 148.438 | 24.997 | -24.9206 | 1 | Flow sweep - 2 | Flow_curve_example.xls |
| 62 | 22.0 | 0.057866 | 0.794341 | 0.072847 | 155.485 | 24.997 | -25.0953 | 1 | Flow sweep - 2 | Flow_curve_example.xls |
| 63 | 23.0 | 0.052395 | 0.630945 | 0.083042 | 162.535 | 25.001 | -24.8977 | 1 | Flow sweep - 2 | Flow_curve_example.xls |
| 64 | 24.0 | 0.048758 | 0.501209 | 0.097282 | 169.591 | 24.996 | -25.1164 | 1 | Flow sweep - 2 | Flow_curve_example.xls |
| 65 | 25.0 | 0.045239 | 0.397933 | 0.113685 | 176.654 | 24.999 | -24.8320 | 1 | Flow sweep - 2 | Flow_curve_example.xls |
| 66 | 26.0 | 0.042102 | 0.316361 | 0.133082 | 183.713 | 25.002 | -24.6545 | 1 | Flow sweep - 2 | Flow_curve_example.xls |
| 67 | 27.0 | 0.038813 | 0.251194 | 0.154514 | 190.778 | 24.997 | -24.5867 | 1 | Flow sweep - 2 | Flow_curve_example.xls |
| 68 | 28.0 | 0.036004 | 0.199529 | 0.180445 | 197.823 | 25.001 | -25.0682 | 1 | Flow sweep - 2 | Flow_curve_example.xls |
| 69 | 29.0 | 0.033902 | 0.158457 | 0.213948 | 204.876 | 25.001 | -24.4285 | 1 | Flow sweep - 2 | Flow_curve_example.xls |
| 70 | 30.0 | 0.032007 | 0.125873 | 0.254278 | 211.941 | 25.010 | -24.5144 | 1 | Flow sweep - 2 | Flow_curve_example.xls |
| 71 | 31.0 | 0.030270 | 0.100015 | 0.302651 | 219.003 | 24.993 | -24.9915 | 1 | Flow sweep - 2 | Flow_curve_example.xls |
| 72 | 32.0 | 0.028780 | 0.079428 | 0.362346 | 226.127 | 24.995 | -24.6282 | 1 | Flow sweep - 2 | Flow_curve_example.xls |
| 73 | 33.0 | 0.027333 | 0.063095 | 0.433201 | 233.252 | 25.006 | -24.9416 | 1 | Flow sweep - 2 | Flow_curve_example.xls |
| 74 | 34.0 | 0.026040 | 0.050111 | 0.519641 | 240.369 | 25.007 | -24.5353 | 1 | Flow sweep - 2 | Flow_curve_example.xls |
| 75 | 35.0 | 0.025020 | 0.039809 | 0.628512 | 247.469 | 25.006 | -24.4186 | 1 | Flow sweep - 2 | Flow_curve_example.xls |
| 76 | 36.0 | 0.024103 | 0.031607 | 0.762564 | 254.532 | 25.002 | -23.9567 | 1 | Flow sweep - 2 | Flow_curve_example.xls |
| 77 | 37.0 | 0.023194 | 0.025114 | 0.923548 | 261.572 | 24.997 | -24.4094 | 1 | Flow sweep - 2 | Flow_curve_example.xls |
| 78 | 38.0 | 0.022509 | 0.019941 | 1.128780 | 268.612 | 25.008 | -24.5010 | 1 | Flow sweep - 2 | Flow_curve_example.xls |
| 79 | 39.0 | 0.021778 | 0.015855 | 1.373590 | 275.666 | 24.995 | -24.7634 | 1 | Flow sweep - 2 | Flow_curve_example.xls |
| 80 | 40.0 | 0.021109 | 0.012586 | 1.677160 | 282.723 | 25.006 | -25.1692 | 1 | Flow sweep - 2 | Flow_curve_example.xls |
| 81 | 41.0 | 0.020585 | 0.009999 | 2.058600 | 289.775 | 25.002 | -24.8307 | 1 | Flow sweep - 2 | Flow_curve_example.xls |
82 rows × 10 columns
[26]:
import altair as alt

alt.Chart(flow_curve.tidy).mark_point().encode(
    alt.X('Shear rate', scale=alt.Scale(type='log')),
    alt.Y('Stress', scale=alt.Scale(type='log')),
    color='stepname')

#.interactive()
[26]:
Import data from Rheoml
[ ]:
# Download example of xls file format
import requests

url = 'https://raw.githubusercontent.com/rheopy/rheofit/master/docs/source/_static/Flow_curve_example.xml'
r = requests.get(url, allow_redirects=True)
with open('Flow_curve_example.xml', 'wb') as file:
    file.write(r.content)
[ ]:
# In summary from xml (rheoml schema)
# to do - add to rheology_data class the option to import from xml
# Solve naming problem for shear stress and shear rate

steps_table_list=rheofit.rheodata.dicttopanda(rheofit.rheodata.get_data_dict('Flow_curve_example.xml'))
for data in steps_table_list:
  plt.loglog('ShearRate','ShearStress',data=data,marker='o')
  plt.xlabel('$\dot\gamma$')
  plt.ylabel('$\sigma$')
  plt.legend()
